
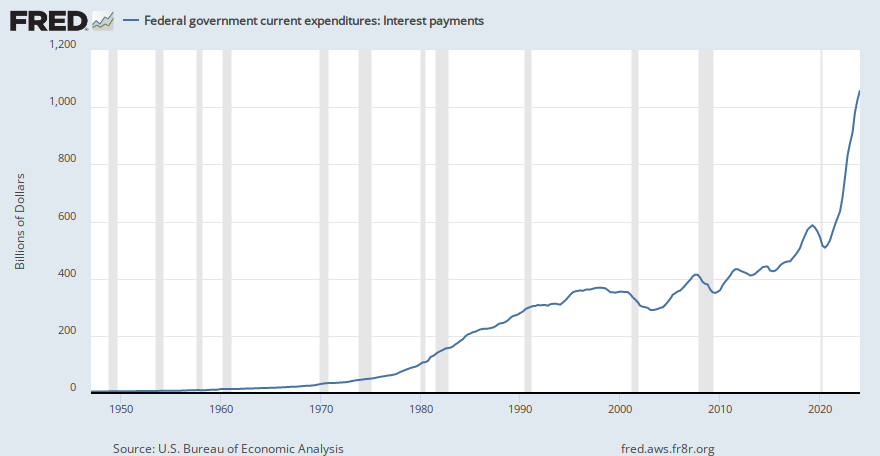
This interest payment graph went vertical after the 2020 election.
Federal government current expenditures: Interest payments
Federal government current expenditures: Interest payments
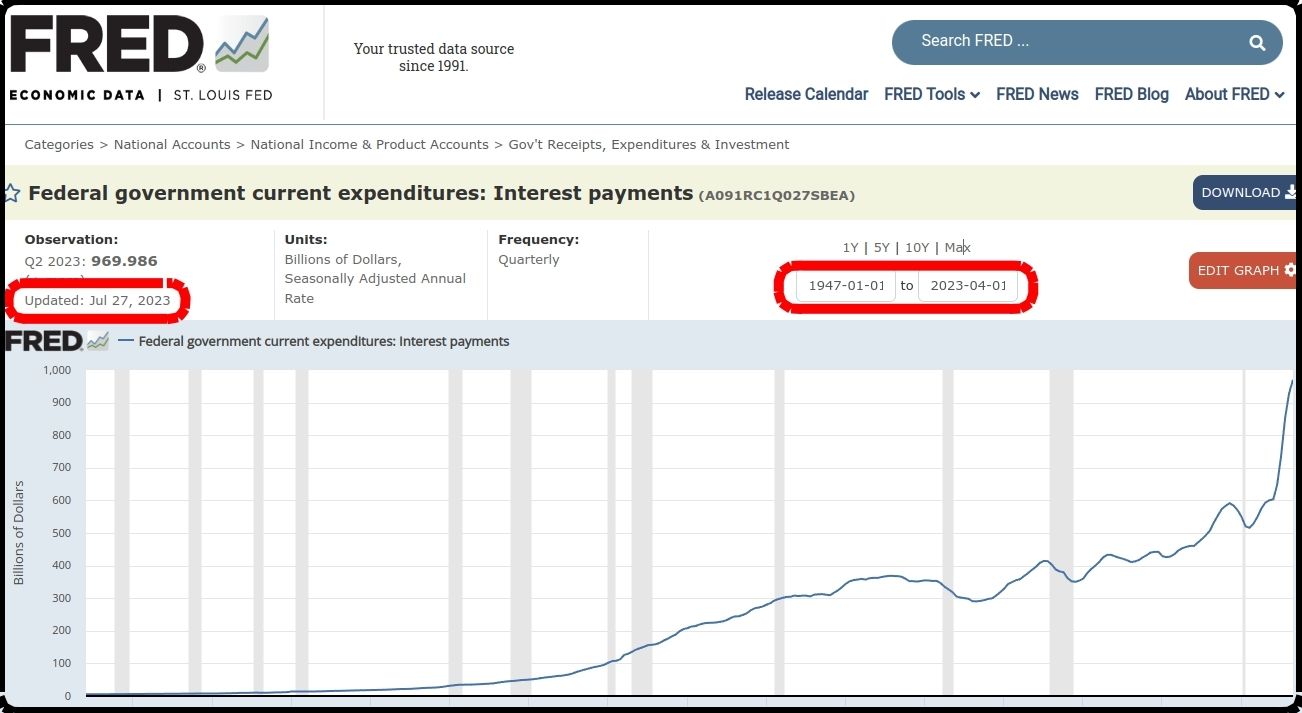
It shows "updated July 27th" but the actual data (upper right blue button) was last updated on April 1st. There's no July update and I suspect the Oct update won't appear in two weeks, either. We can extrapolate a $27 billion increase per month from the past year, bringing today's total to $1.1 trillion.
"Things fall apart".

Comments