
The company had a troubled analytics system stuck in beta development, hosted on 20 servers and designed for millions of daily users. After two months I realized the market expectation was 6K concurrent users and unlikely to grow much.
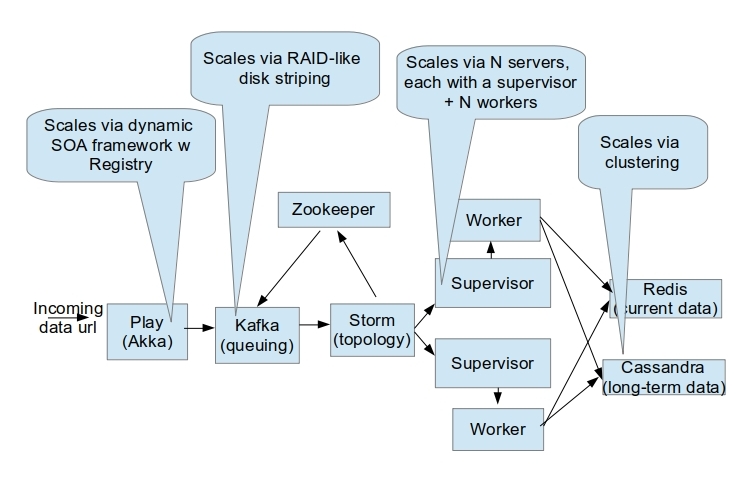
The original architect created a custom-built 18-wheel truck to deliver a cheeseburger. A small cheeseburger. It was a massive mismatch so I replaced it with a small bicycle.
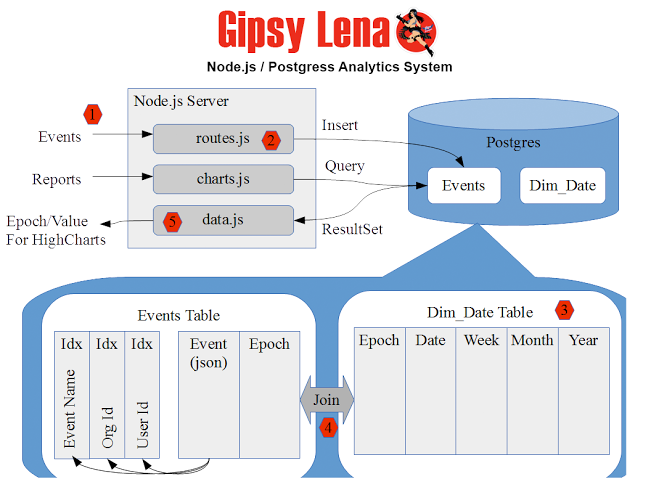
1) Incoming json events
2) Events copied to event log, time-series stream, etc.
3) Dimension table for time bucketing
4) Join on Epoch field, finest granularity is one day.
5) Epoch/Count json fields match HighCharts input json.
I wrote a simple time-series analytics system in eight weeks with Node.js and Postgres since they were already in the project, although I had limited experience with them.
We prototyped with InfluxDB time-series database but after seeing its design, I realized I could do the same with Postgres using data warehousing scripts and have better control over performance tuning.
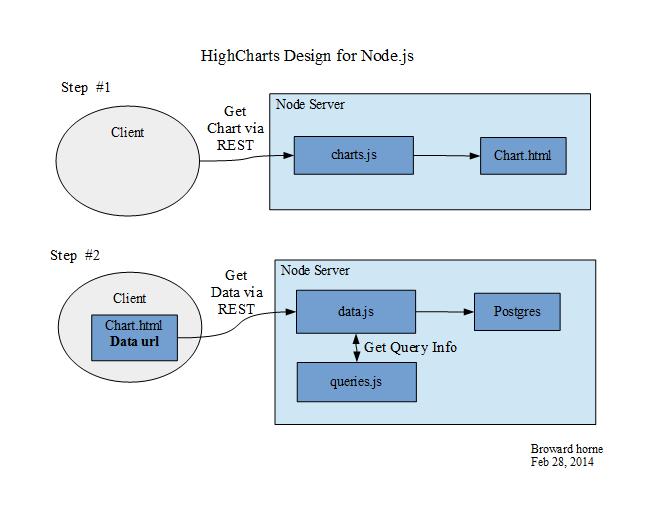
It's simple, effective and environment-appropriate, should handle 15K-20K concurrent users and is easily scaled 10-fold by sharding incoming events at the Node.js entry URL. Node.js hosts the incoming / outgoing URLs, Postgres stores json events in a single table and there's a Time dimension table for time-slicing the epoch/count output, which is impedance-matched to the Highcharts json inputs.
Many programmers couldn't have written this system; not because it's too complex but because it's too simple. 
Comments