
RealMeme.com was the inspiration for Google Trends.
I started data mining the Internet in 1993, searching for S-curve trends in technology. I developed several semantic concepts such as sentiment analysis, quality of service, inflection points, marginal utility, diffraction, overdriven memes (fraud), manipulation patterns. In 2004 I launched a website, RealMeme.com, then gave a presentation at DEFCON 13 in 2005. I was well ahead of the curve:
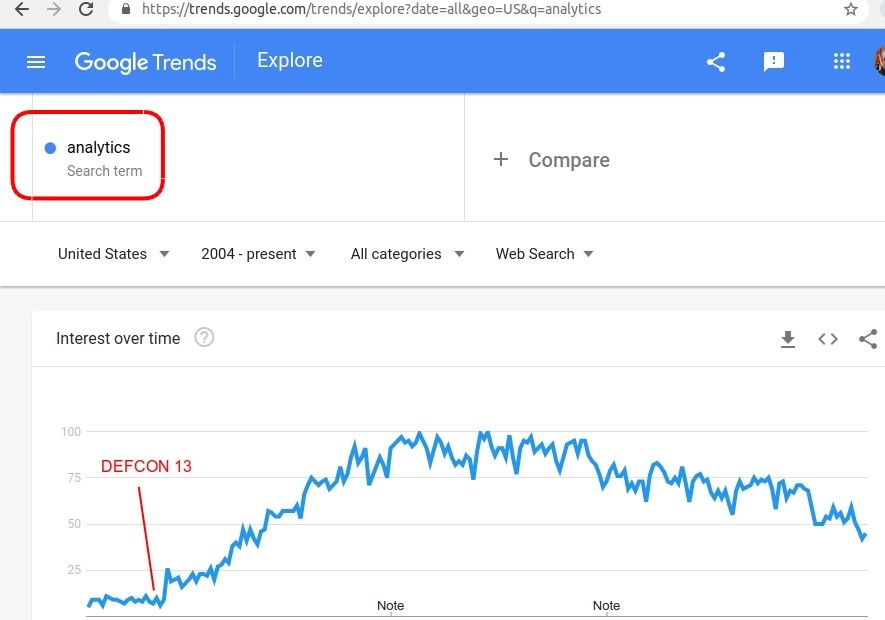
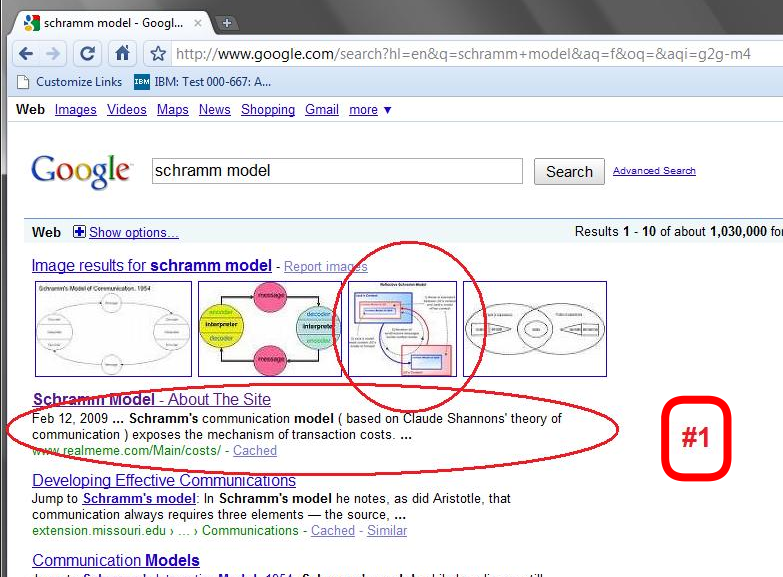
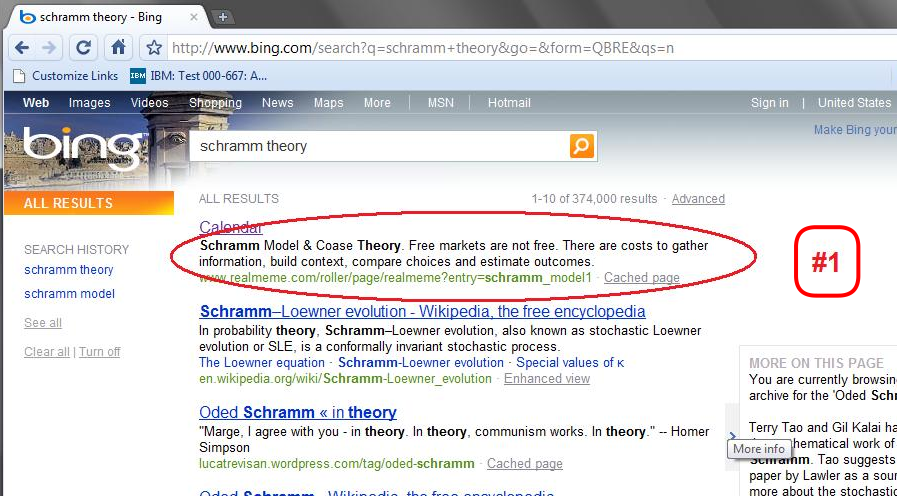
RealMeme.com was mostly as an experiment and ended with 2,000 readers per month, a total of 100K+ over six years. It was in the Internet Top 100,000 sites in 2005, the most popular page was Schramm Communication Model which ranked in the top 3 on several search engines.
The Reflective Schramm Model is an original concept by me:

Here are some of my most interesting graphs/analysis:
Recession Predictions
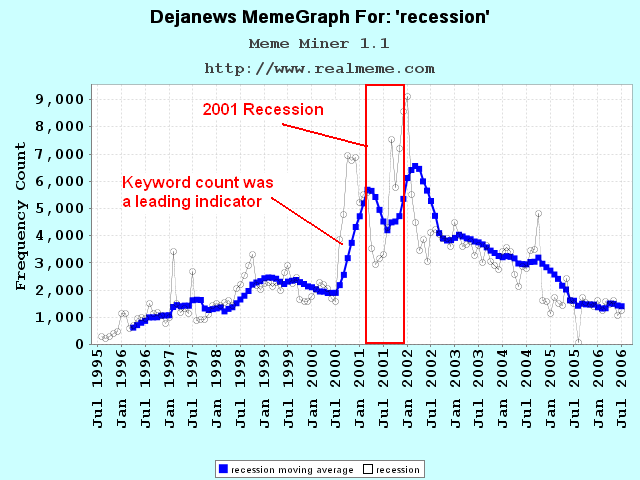
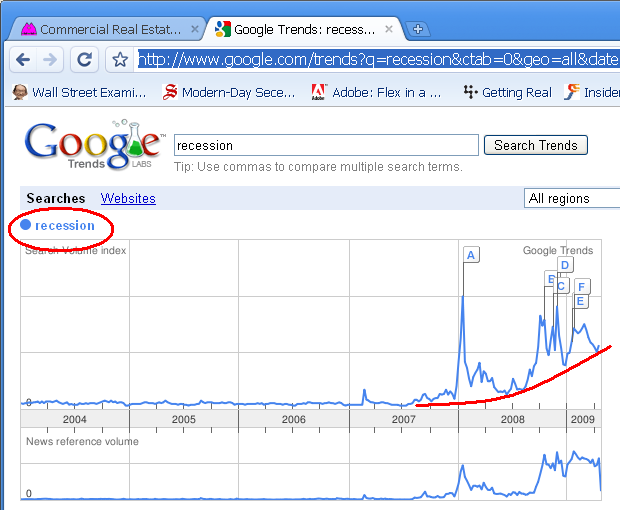
The keyword "recession" was a leading predictor of the 2001 recession (first graph). It was also a leading indicator of the 2008 recession (second graph, and notice the similarity of the double-peaks). I created the first graph in 2006 and was expecting a recession in 2008 based on keyword changes.
Mental Quality of Service
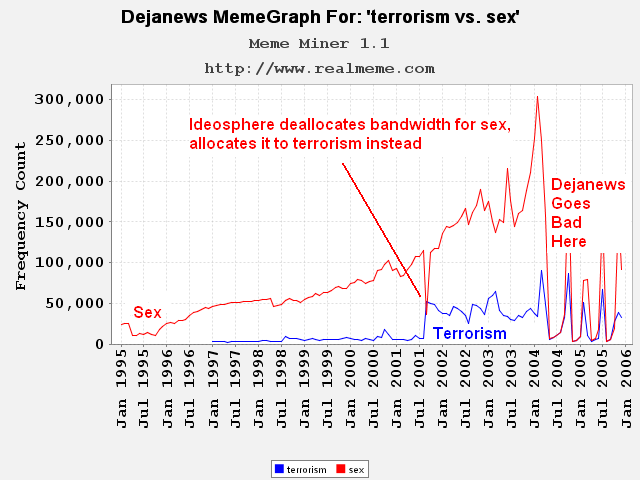
Human beings have finite bandwidth, and so human participation on the Internet has finite bandwidth, too. Finite bandwidth suggests there must be mental "quality of service", as demonstrated in this graph. On 9/11/2001, everyone's mind turned to "terrorism" but where did that extra bandwidth come from?
As it turns out... "sex".
Movie Marginal Utility
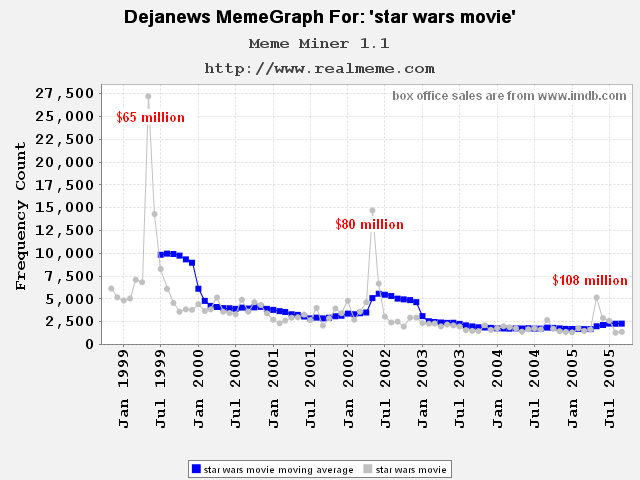
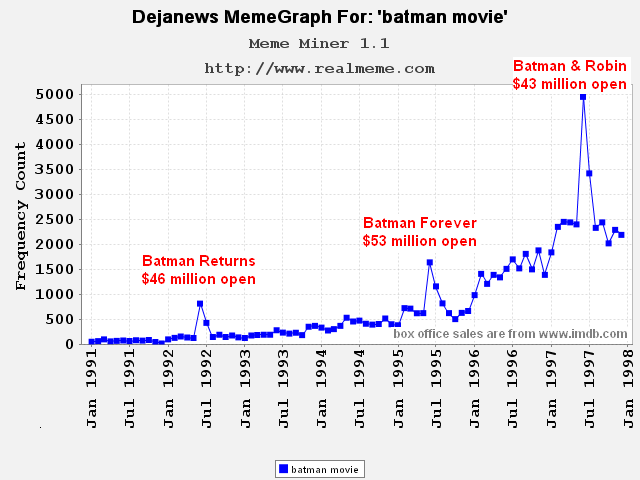
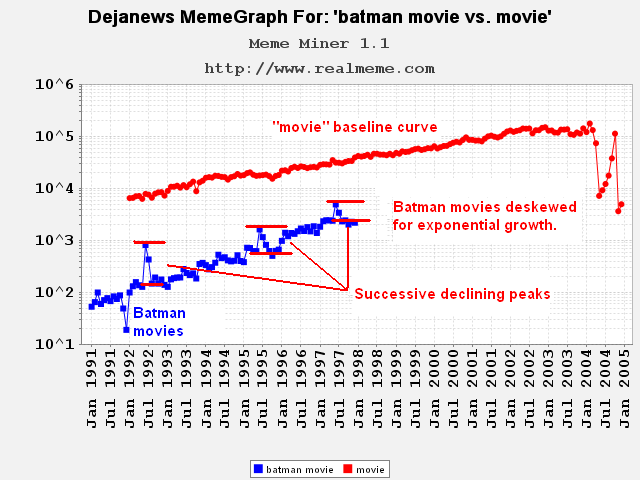
For a few months I predicted movie box office receipts from data-mining and was fairly successful. Movie names are surprisingly well-branded and show "marginal utility", i.e. even as box office receipts rise for each sequel, "movie buzz" declines.
The draw of sequels is familiarity of characters and storylines so there's less desire to discuss each sequel. For the Batman graph, I did a rough deskew to remove the bias of internet growth during that period. This marginal utility pattern is quite common for movie sequels.
Sentiment Graph
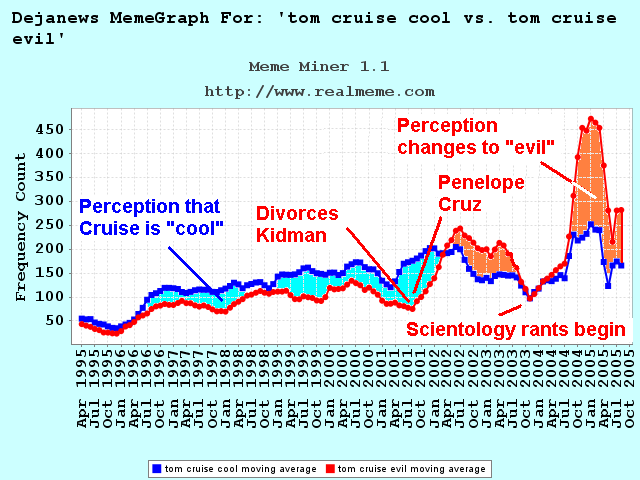
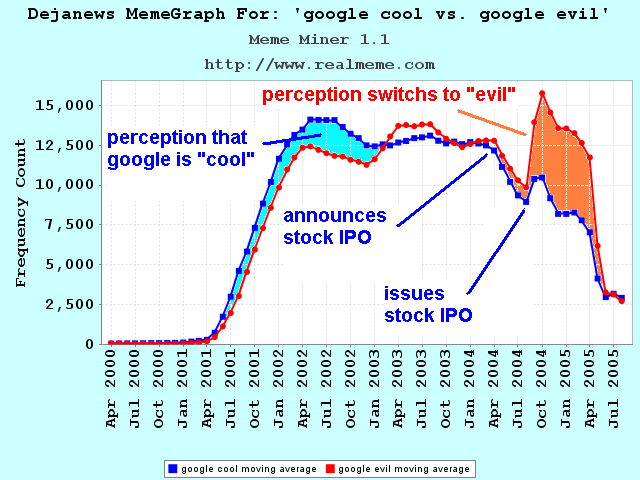
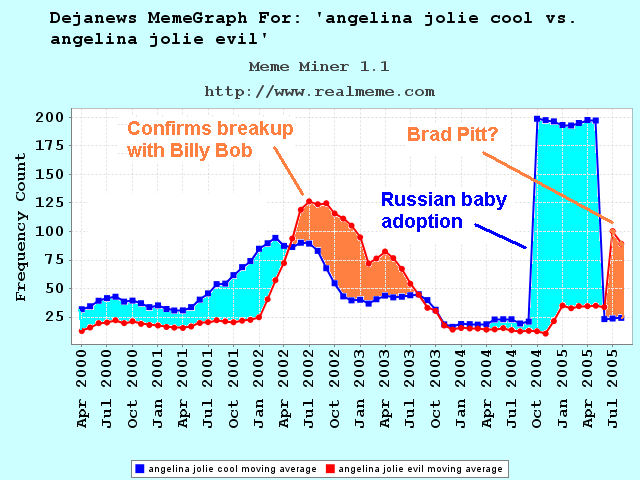
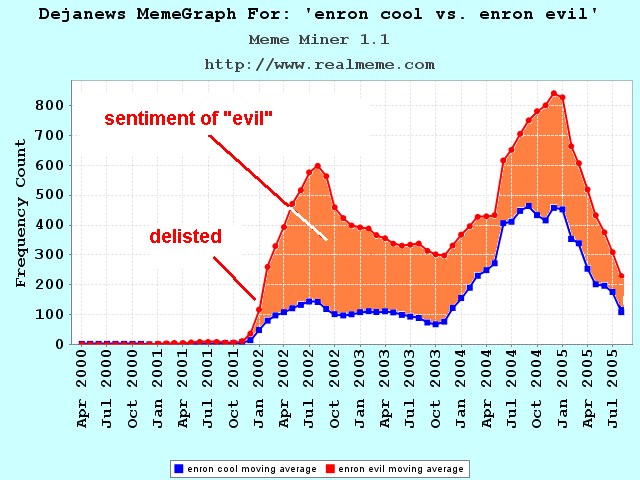
Real-time sentiment is probably old news to most people but I created these graphs in 2005, a year before Twitter existed. These graphs are based on set theory applied to queries of "google and evil" versus "google and cool".
Comments