
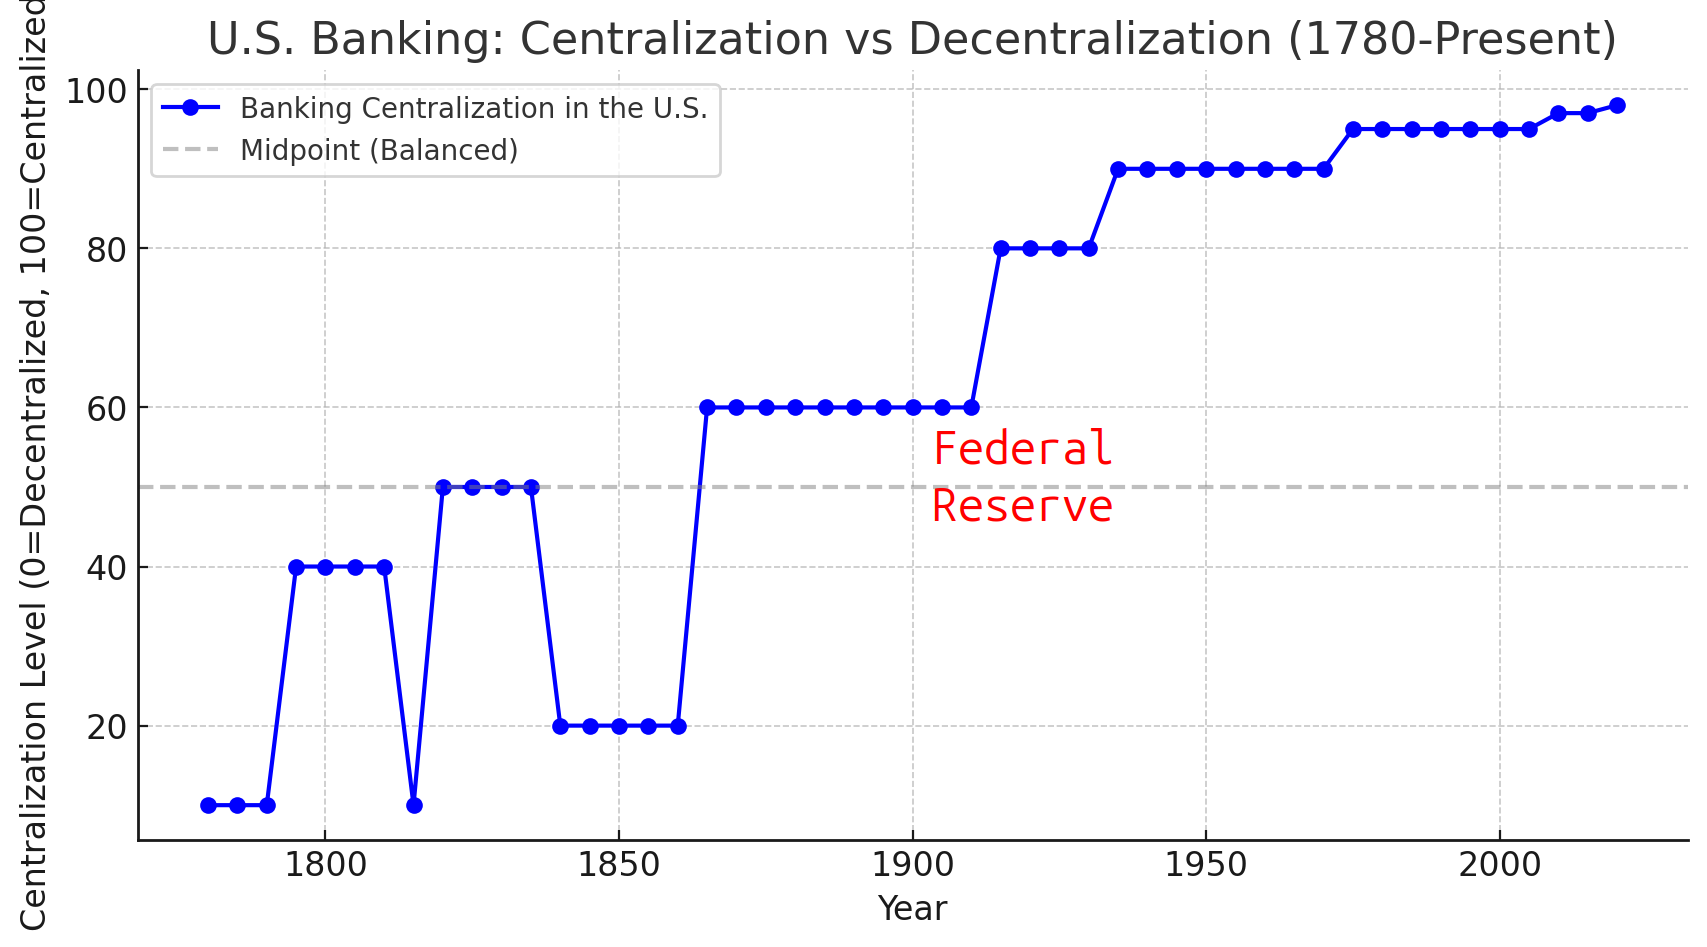
I have no idea what data or methodology ChatGBT used to generate this graph, I gave it a pretty abstract request, but the graph matches my memory of history. US banking was somewhat cyclical until 1913.
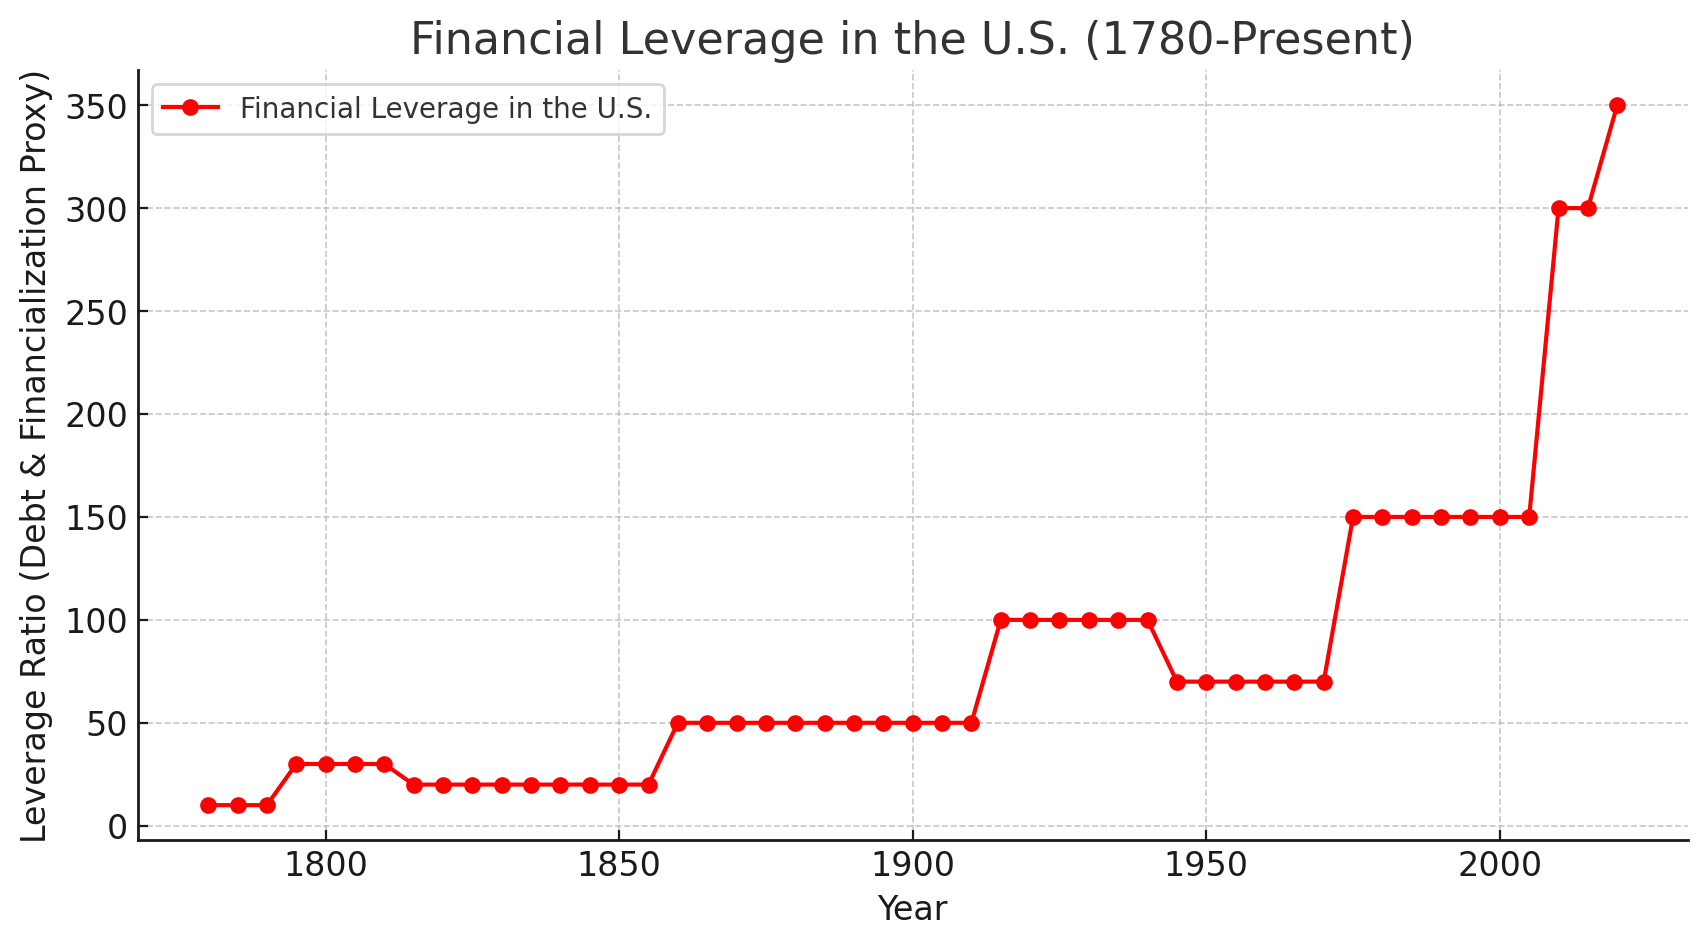
Financial leverage is roughly correlated with centralization of banking.
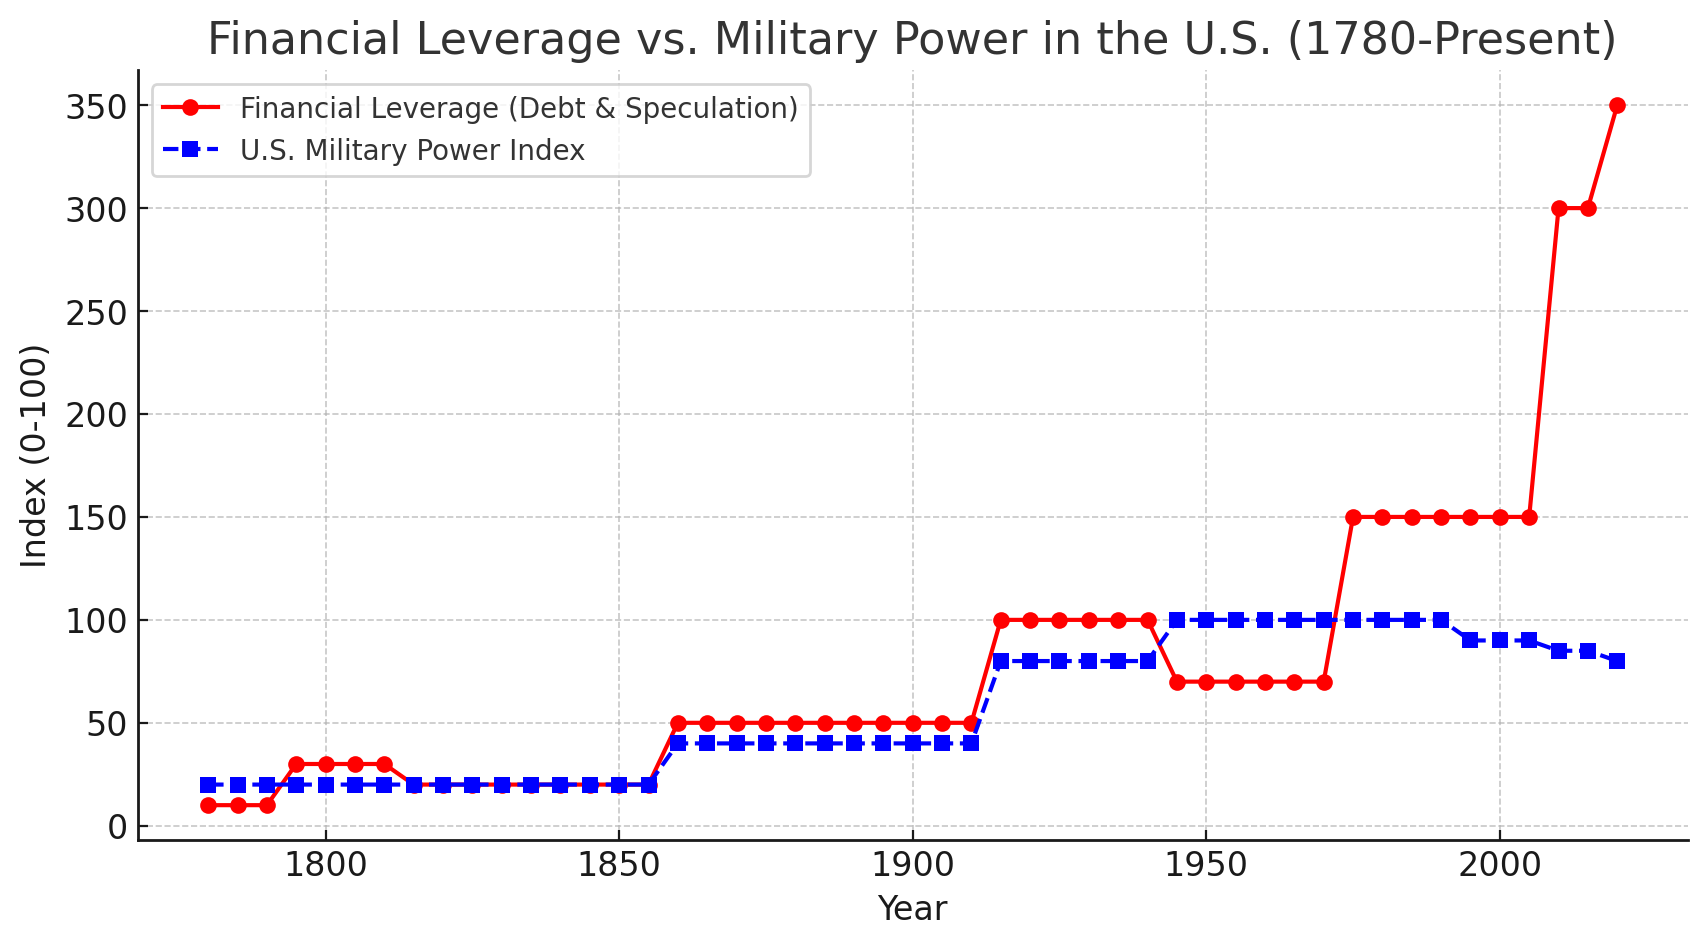
Military force (and spending) was roughly correlated until the past couple of decades.
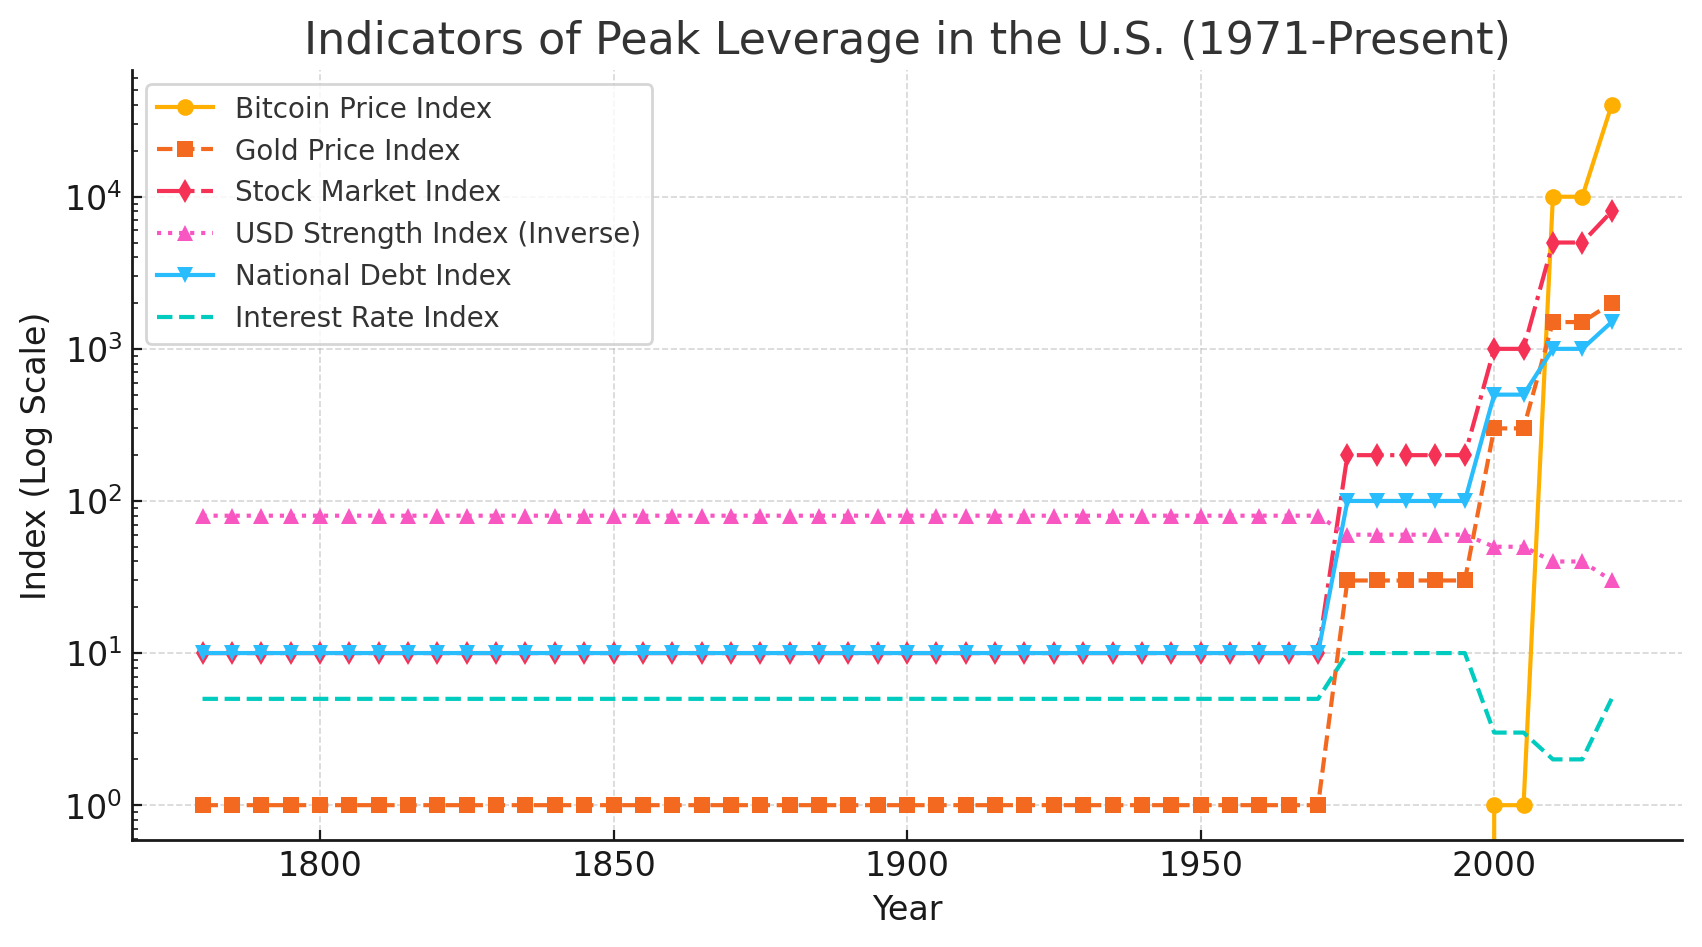
I saved the best for last. Note that this is a logarithmic graph, see the powers of 10 on the Y axis? Data preceding 1971 is too small to see in the context of current valuations. Incidentally, the US discarded the gold standard in 1971.
The magic of paper money.
Everybody gets rich.
For awhile.

Comments